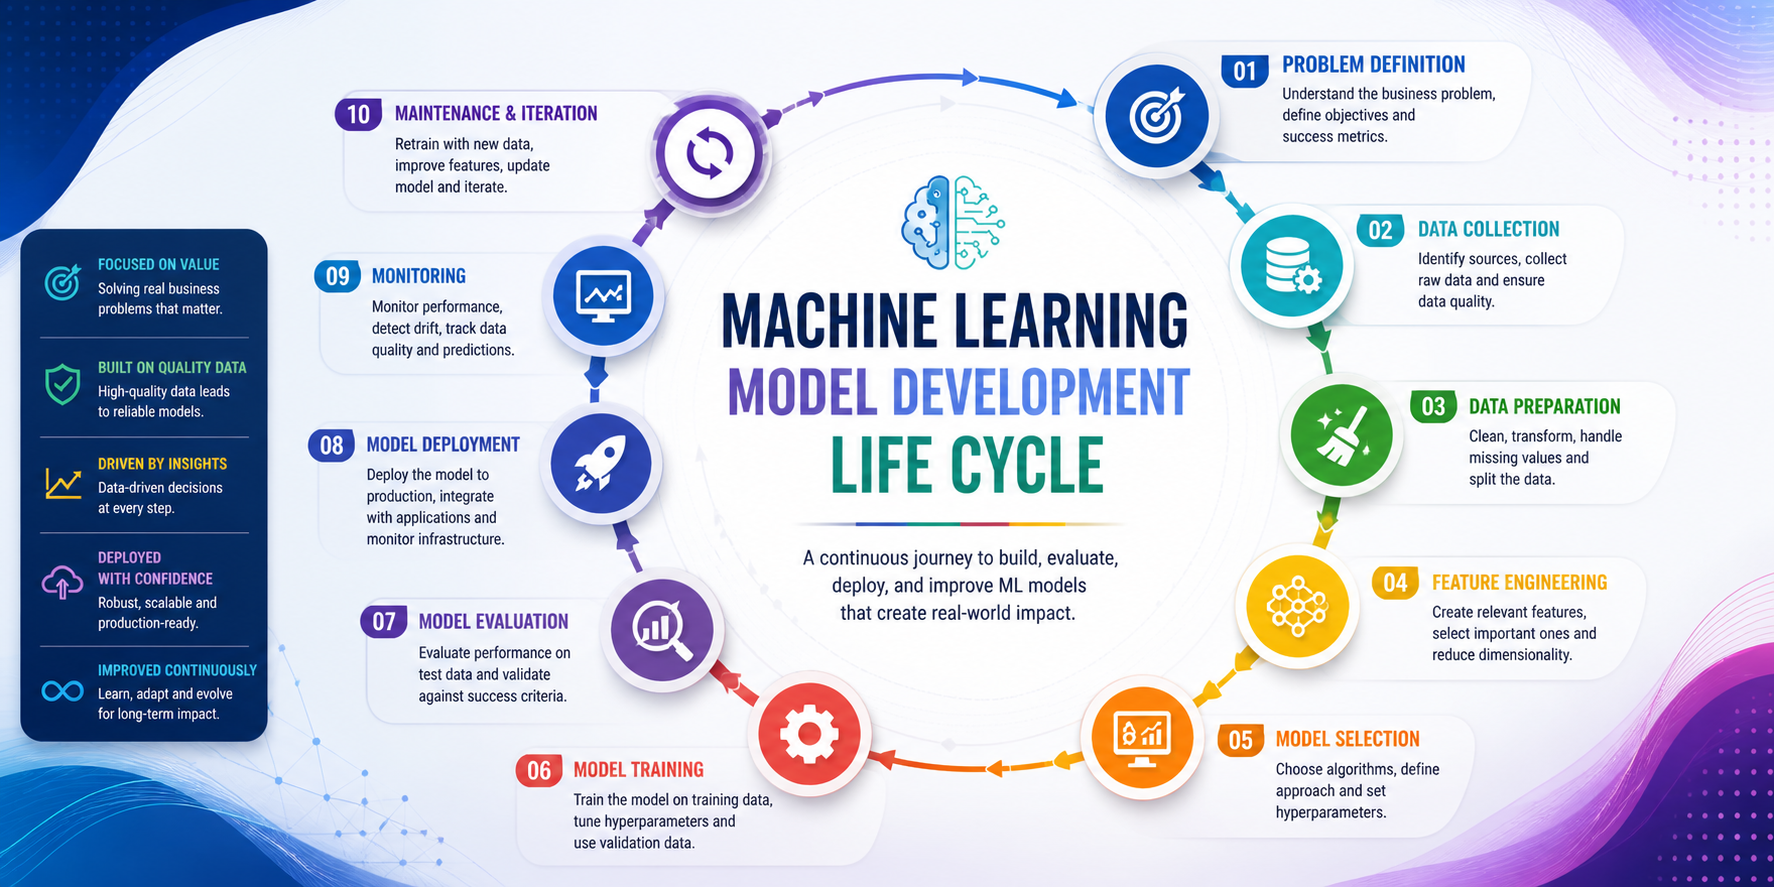
Machine Learning Model Development Life Cycle
Machine Learning Development Life Cycle is a process used by the Data Science industry to design, develop and test high quality Models. It is also called as Model Training Process. Target of this article is to give a real time insight about a model development within an analytics project rather discussing about the existing theoretical frameworks.
1. Business Requirements & Hypothesis Designing
Understanding about the Business Domain and the Business requirements is the foremost and essential part in any of the Machine Learning based project because in the end it all depends on the ROIs & KPIs in terms of Optimization, Revenue Generation and Profitability of the the investments by the businesses into the Machine Learning Projects.
Hypothesis Designing will be followed by the Business Requirement Gatherings and Domain understandings.
2. Exploratory Data Analysis
Commonly called as EDA is referred to the Data Understanding and Data Analysis which mainly comprises of the relationship identifications between the various variables in the form of visualizations and numbers. It can be a Qualitative Analysis or Quantitative Analysis. For ex, Pie Charts, Bar Charts, Histograms, Distributions, Skewness, Proportions, Inter-quartile Ranges, Dispersion, Central Tendency of Data etc. Most of the time a good data exploration can provide the useful insights within the data as well as solve almost 70% of the problem in the EDA stage only.
3. Data Pre-Processing & Data Cleaning
Data Pre-Processing & Data Cleaning are more of the processes where an Engineer will make the data ready for the consumption of the Machine Learning Model. The most commonly used techniques are as follows:
- Missing Value Checks & Missing Value Imputations
- Removal of the unwanted data (Drop the useless columns/Drop the columns with having more than 30% to 40% data is missing/Drop the rows with Null Values etc.)
- Data Optimization on the basis of Domain or Business recommendations.
- Outlier Detection & Removal
- Dimension Reduction
- Balancing the Imbalance Data by using SMOT Analysis, Over-Sampling & Under-Sampling.
- Duplicate records removal
4. Feature Engineering & Feature Selection
Feature Engineering or Feature Selection is a technique to identify the most important features within a dataset. Features can be derived also from the existing feature space as well as can be reduced. Few of the most commonly available feature engineering and feature selection techniques are:
- Correlation Checks or Collinearity Checks
- Zero-Variance Checks
- Principal Component Analysis or PCA
- Categorical Data Encoding
- Data Normalization
- Data Standardization or Scaling
- Log Transformations
5. Machine Learning Model Selection
Machine Learning Model selection is based on the type of business problem we are handling or more than that depends on the application and end results. Few of the most common problems available in the Machine Learning area are Classification, Regression, Clustering etc. As far as a pure Machine Learning project is concerned the below mentioned Algorithms are highly used ones industry wide:
- Decision Tree
- Random Forest
- Regression
- K-Means or Clustering
- K-Nearest Neighbors or KNN
- Support Vector Machine or SVMs
- Logistic Regression
- Naive Bayes
- Artificial Neural Networks or ANNs
6. Model Hyper-Parameter Tuning
Hyper-Parameter tuning is an iterative process which actually consumes a lot of time after the Data Processing step. Tuning of model parameter depends on multiple aspects like Cross-Validation, Outlier or Noisy data removal etc. which in turns make sure that the model shouldn't be running into Over-fitting. It is a hit & try process with the permutation & combination of different model parameters which generates the optimal values where model achieves a high accuracy without running into over-fitting.
A commonly used method into the Analytics Industry to avoid the hectic procedure of the iterative model tuning is GridSearchCV.
7. Model Performance
The developed model has to be tested on the unseen data before deployed into the field or production environments. There are various KPIs available in the Machine Learning area for testing the accuracy and performance of a model which can vary on the basis of models.
- Confusion Matrix
- Area Under the Curve or AUC
- Precision & Recall
- Sensitivity & Specificity
- F1-Scores
- R-Square
- Gini Values
- KS Statistics
8. Model Deployment
The trained Machine Learning Model has to be pipe lined by using various pipe lining methods available which basically generate the data-flow for the model and for the prediction purposes. Trained Model has to be pickled before the deployment which is a platform independent executable in layman terms. The pickled model object can be deployed using various methods as mentioned below:
- Rest APIs : Rest APIs like Flask/Bottle etc. can be used for wrapping the generated pickle and can be directly deployed to the in-house servers or can be integrated with the websites etc.
- Micro-Services : The pickle object can be containerized and deployed over the cloud infrastructures as well with the help of the cloud based deployment methodologies. Most commonly used effective cloud services are AWS/Azure/GCP while Openshift/Oracle/IBM Clouds are still not stable as sustainability point of view.
9. Visualizations
Mostly the deployment stage is considered as the last stage in most of the Machine Learning Projects but as per my personal experience and the applications i have seen within the industry its extremely important to capture the model results and recommendations in the form of visualizations. There are two reasons for that Firstly, These visualizations can be used by the Businesses for understanding the various business KPIs, Customer Behaviors etc. and Secondly, can also be used by the Customers to capture and check their personal metrics. These Visualizations can be shown on the customized user interface or on the dashboards. Most commonly used visualization tools are:
- Tableau
- Power BI
- Splunk
- Dynatrace
- Qlikview
- Graphana
- R-Shiny
- Plotly

Talk to our Career Advisor
Speak with our career advisor to get clear direction, understand the right opportunities, and take the next step in your career with confidence.

Get Your Course Brochure Now
Fill in your details and receive complete course information instantly.
- Detailed course syllabus & modules
- Duration, fees & learning format
- Certification & career opportunities
- Placement support & real-world projects
- Demo class & expert guidance info
Copyright © 2026, Edvora. All Rights Reserved.